Headroom Across 80 Agent Runs: What Happened to Token Usage
I recently came across another repository promising to sharply reduce context usage for LLM agents: Headroom. I am currently researching this topic through SKILL.state and have already written about the initial results on Habr. Those were early engineering experiments; more rigorous testing is still underway.
Headroom's approach caught my attention, so I decided to give it a quick run through the same test harness alongside my other experiments. This article is about what happened.
Headroom compresses data before it reaches the LLM. An agent reads files, receives logs and command output, then sends that history back to the model. Reducing repeated data should reduce usage. In theory. But what happens in practice, and how does it affect the quality of the results?
We ran two sets of experiments: ten Terminal-Bench 2.1 tasks, and five small projects with three repetitions each, previously used to test SKILL.state. That made 80 attempts in total. Across pairs with complete usage accounting, Sol's input fell by 4.1% on Terminal-Bench but rose by 40.7% on the small projects. Astra's input fell by 25.3% on those same projects.
Requests saved before and after compression helped make sense of these results.
What we tested
Headroom can sit between an agent and the model provider. The library processes text, code, and structured data. Its CCR mechanism stores the originals locally so the agent can request them through a retrieval tool. The README for the pinned version gives examples of 21–57% compression, and more than 90% for repetitive JSON and logs. It also notes that dense text compresses much less.
We used headroom-ai[proxy,code]==0.37.0 with the local Kompress ONNX model. We tested the proxy with compression enabled, without Serena, headroom learn, model switching, or response shortening. We did not run headroom wrap, so the findings apply only to this integration mode.
Each task had two variants:
- Native: the request passes through the proxy unchanged.
- Headroom: the same agent and model, with request compression enabled.
Within each pair, the task, container resources, and tools stayed the same. We randomized and balanced the order of the variants in advance.
We recorded external check results, input, uncached input, output, model calls, and agent runtime. Input already includes cached tokens; output includes reasoning tokens. We did not convert subscription token usage into monetary costs.
First set: ten Terminal-Bench 2.1 tasks
This set used gpt-5.6-sol with high reasoning: one attempt per task in each mode, for 20 runs in total. These were ten selected TB2.1 tasks, not the full benchmark. They included extracting data from ELF files, setting up a PyPI server, building SQLite, a Git webserver, and editing a large text.
| Metric, total across ten tasks | Native | Headroom | Change |
|---|---|---|---|
| Successful tasks | 8/10 | 7/10 | −1 |
| Input | 2,148,064 | 2,060,765 | −4.1% |
| Uncached input | 308,960 | 267,997 | −13.3% |
| Output | 61,204 | 63,279 | +3.4% |
| Model calls | 113 | 122 | +8.0% |
| Agent runtime, minutes | 37.7 | 35.1 | −7.0% |
The totals hide substantial variation: input fell by 45.4% on extract-elf and rose by 85.6% on pypi-server.
The only difference in task success was the Git webserver. With Headroom, the agent did not start sshd, even though the unchanged output showed that port 22 was not open. The compressor also removed some if/then syntax from the shell hook shown to the model; the file itself remained intact. No link between compression and the failure has been established: one attempt per mode, together with limitations of the evaluator, does not support that conclusion.
One attempt per mode cannot tell us how stable a result is. The next set therefore included repeated runs.
Second set: five projects, two models, three repetitions
We took five basic tasks from the earlier harness: a taskboard CLI, a CSV analyzer, a template engine, an HTTP key-value server, and a dependency scheduler. For each task, we ran three repetitions in both modes with two profiles:
gpt-6-astra,mediumreasoning;gpt-5.6-sol,highreasoning.
That added another 60 attempts. Astra called tools directly; Sol used code mode. Within each profile, Native and Headroom used the same format. We are not ranking the two models against each other here.
Two attempts had incomplete usage accounting. Sol stopped because the provider was overloaded. Astra's stream was interrupted, after which the CLI reconnected and completed the task. We did not replace unknown token counts with zeros. For usage comparisons, we excluded both sides of each affected pair, leaving 14 complete pairs per profile.
| Headroom relative to Native | Input | Uncached input | Output | Model calls | Agent runtime |
|---|---|---|---|---|---|
| Astra medium | −25.3% | −26.3% | −8.1% | −14.4% | −8.6% |
| Sol high | +40.7% | +17.2% | +7.2% | +27.9% | +12.0% |
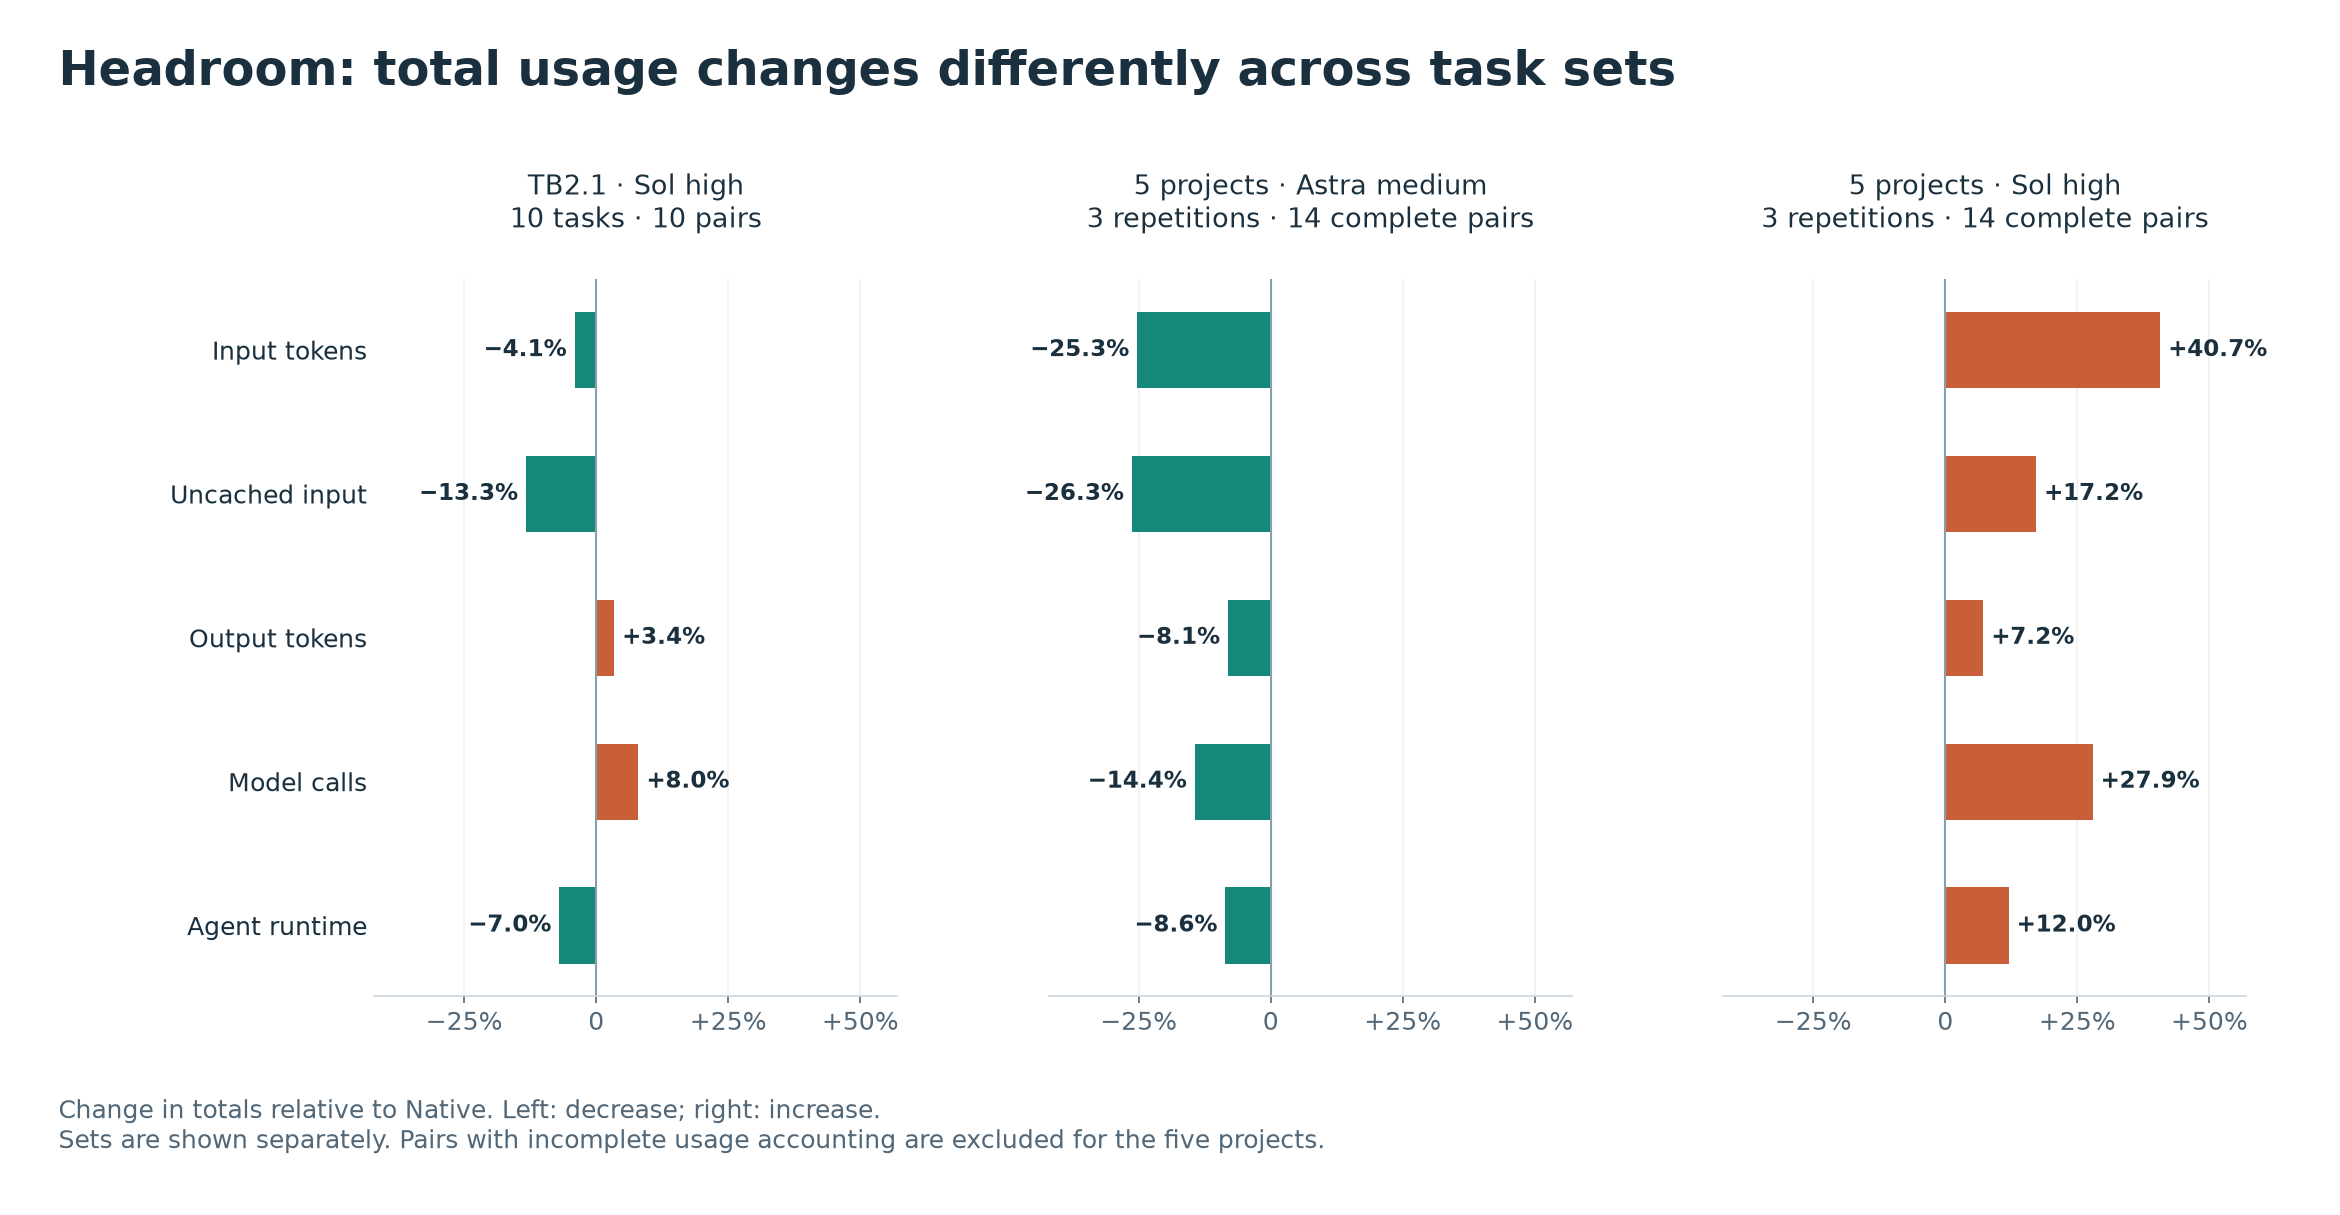
Changes in usage with Headroom relative to Native across three comparisons.
Full success required passing every external check and the agent finishing normally. Astra achieved 15/15 in both modes; Sol achieved 13/15 with Native versus 15/15 with Headroom.
This does not establish an advantage in quality. One Native run of Sol was interrupted by provider overload even though its code passed the checks. Another lost a point for returning {"deleted":2} rather than an id field that the specification did not require. An additional check confirmed that deletion worked; we left the original score unchanged.
The repetitions do not tell a uniform story either. For Astra on taskboard, input fell in all three pairs, by 35–45%. On HTTP KV, the changes ranged from −8.9% to +25.8%. For Sol on CSV, they ranged from −44.2% to +261.7%. Three repetitions help reveal variability, but they do not make a set of five tasks any more diverse.
The second set included pauses caused by quota limits, available disk space, and technical failures. After excluding pairs whose runs were separated by pauses, the direction of the effect remained the same: Astra's input was 22.7% lower, while Sol's was 53.7% higher. This is a sensitivity check on a smaller sample. The provider's cache was not reset, and Headroom's local state was retained.
How much the compressor itself removed
There are two different measurements here. The first is how many tokens two agents used, each following its own sequence of actions. The second is how much one particular request changed as it passed through Headroom.
For the second measurement, we saved the full JSON before and after the proxy and counted its tokens with o200k_base. The table below shows the reduction in the sum of locally counted tokens across all recorded Headroom requests in each set:
| Set | Reduction in full JSON for Headroom requests |
|---|---|
| TB2.1, Sol high | 3.95% |
| Five projects, Astra medium | 0.22% |
| Five projects, Sol high | 2.63% |
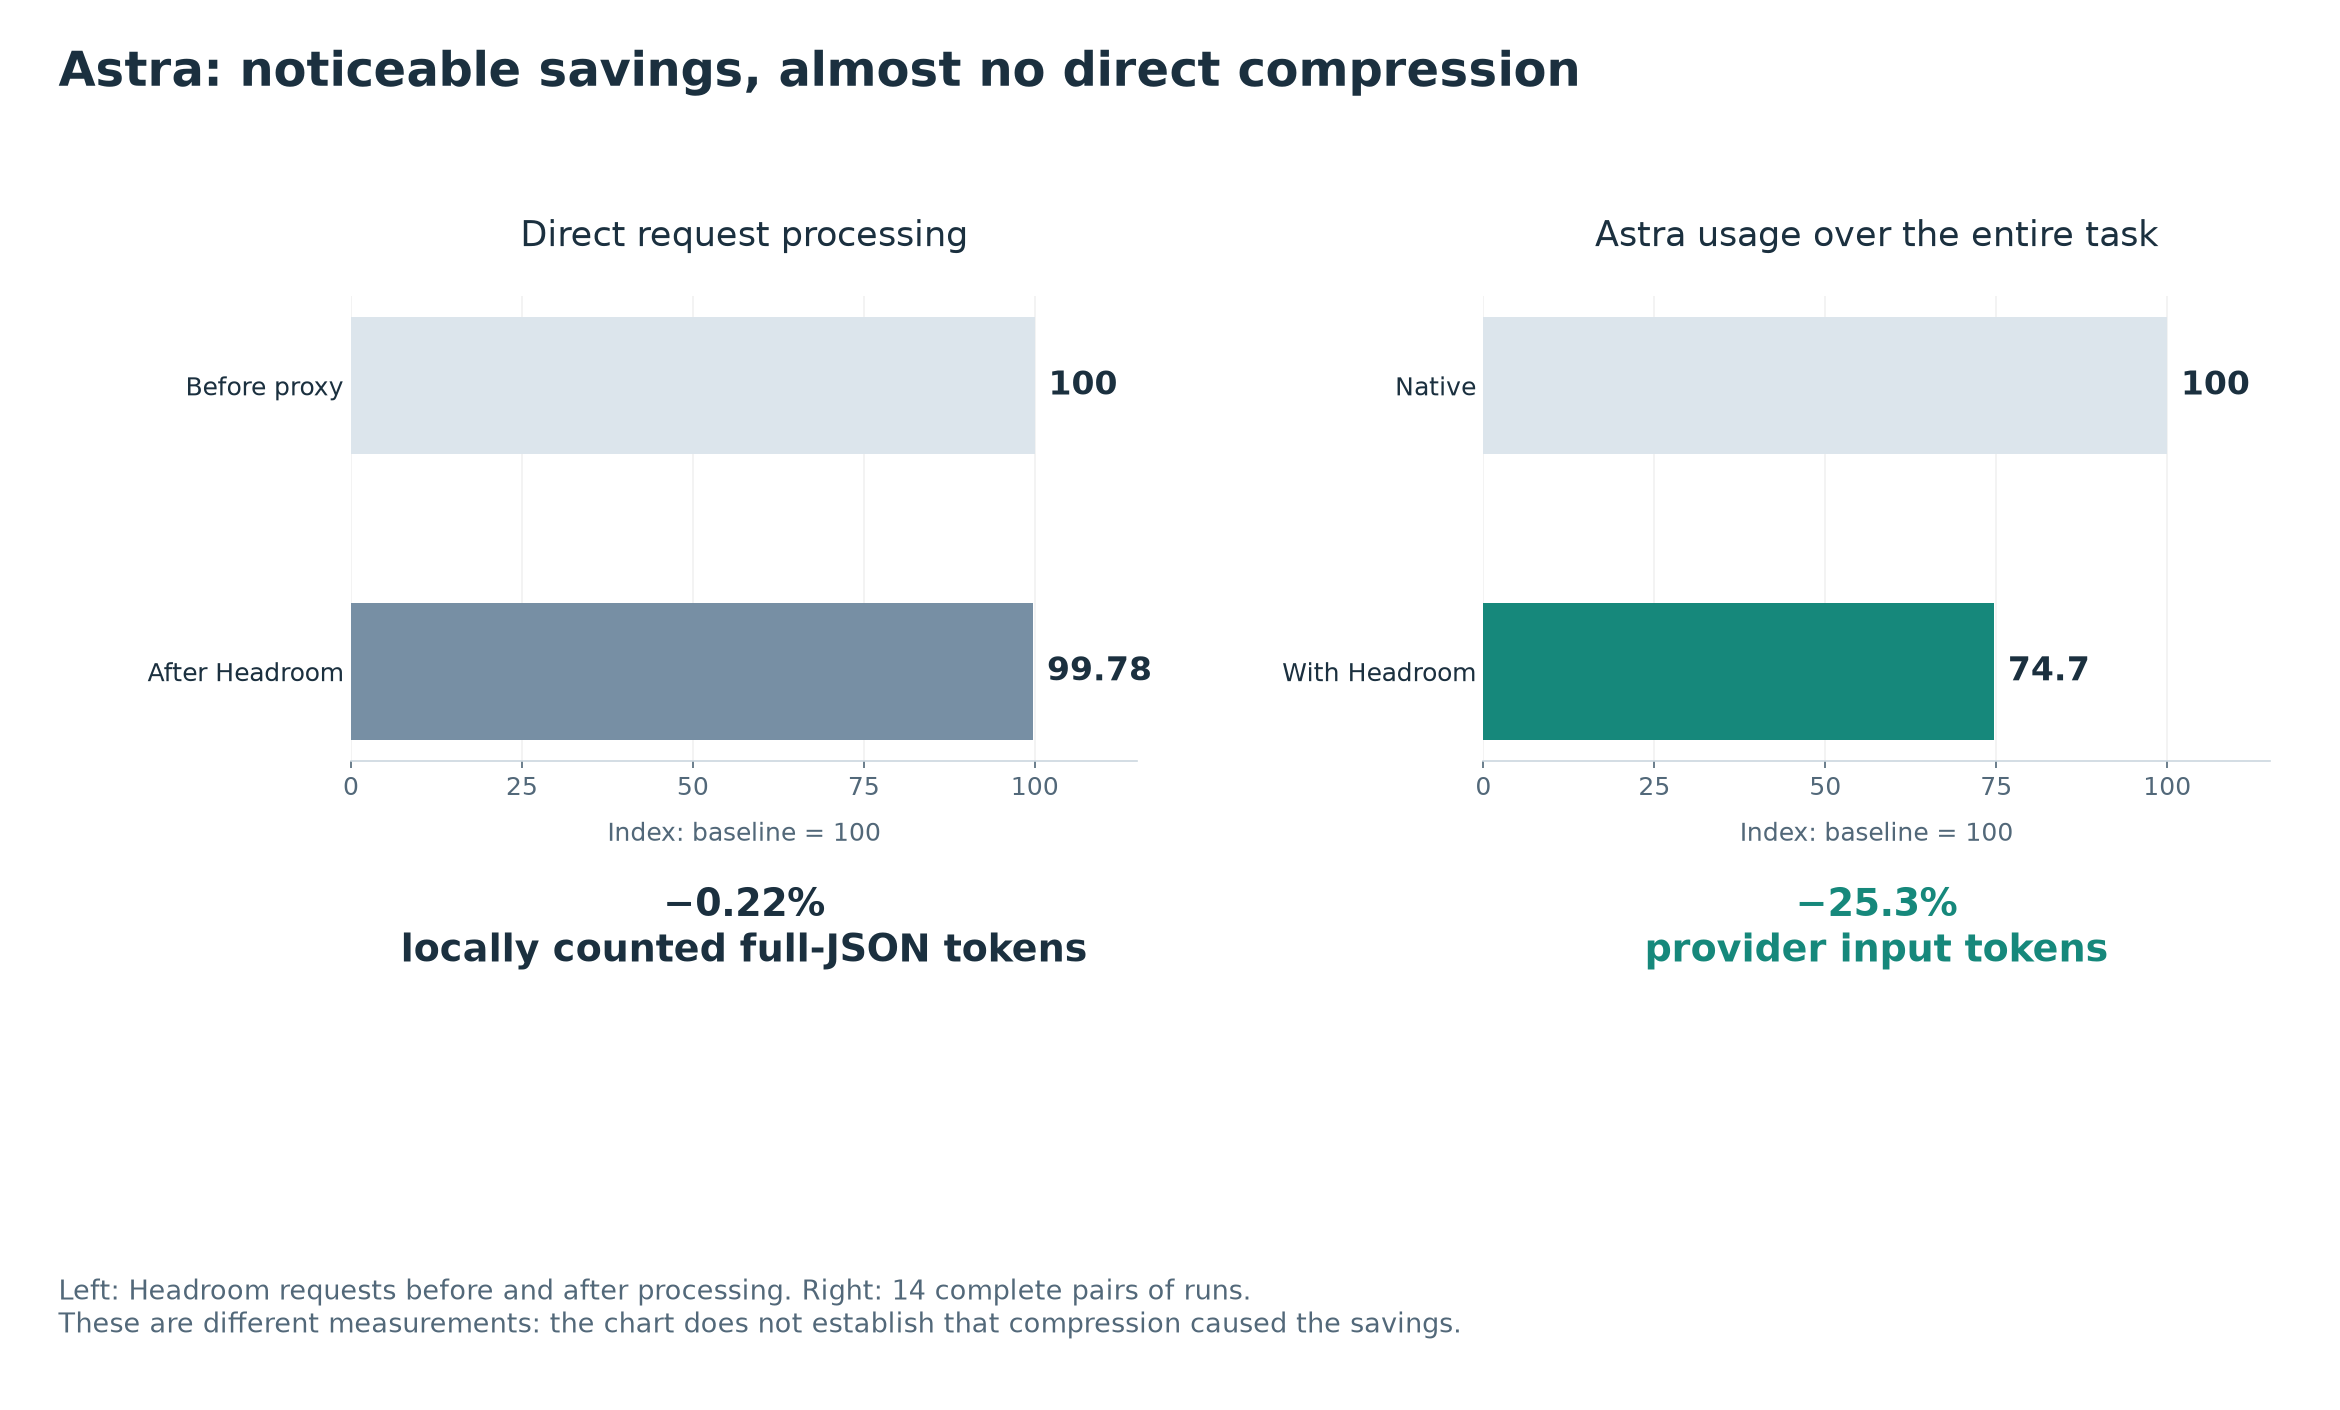
Astra: 0.22% direct JSON compression and a 25.3% reduction in input tokens.
Astra's input token usage fell by 25.3%, even though Headroom itself reduced the JSON by just 0.22%. Output tokens also fell, by 8.1%, and model calls by 14.4%. In other words, a substantial drop in usage came with almost no direct compression: the agent took a different path to the solution and called the model less often.
The local JSON token count is not the same as provider input: JSON includes formatting overhead, so the percentages cannot simply be subtracted from each other. But the difference in scale shows why the savings cannot all be explained by how much text the compressor removed. Whether small changes in context caused a shorter solution path, or whether we are seeing variability in model behavior and the effects of run conditions, remains unknown. We have not established the statistical significance or reproducibility of these savings. Sol's requests were compressed too, but it made more calls and its total usage increased.
Measuring compression on a single request does not predict the token usage of solving a task. That requires observing the agent's entire run, including repeated checks and extra steps. Our experiment does not separate the effect of compression on those actions from ordinary variability in model behavior.
Identical tool results were sometimes compressed differently when sent again; this did not happen with Native. The effect on the provider's cache has not been established. CCR retrieval of the originals was never invoked across all 80 attempts, so its practical usefulness remains untested here.
What this suggests
There was no universal saving on these tasks. Both sets are small samples of already familiar tasks and are not intended as a comprehensive benchmark.
Astra's result surprised me: usage fell noticeably even though Headroom compressed almost nothing. It looks like a fluctuation—simply a more fortunate choice of solution path. Unfortunately, we cannot trace a direct causal relationship here. It is too early to credit the library with these savings.
What I liked most was how restrained Headroom was in this set: where there was almost nothing to compress, it made few changes to the context, and Astra completed all 15 runs successfully in each mode. My impression was that the tool was smart enough to stay out of the way when it was not particularly needed. Still, that is an impression from this particular set. We should remember the TB2.1 failure that occurred only with Headroom, whose cause we could not establish.
For the next set, I would like to try tasks in a domain more suited to compression: analyzing large logs, large JSON API responses, and repetitive search results. That would give the compressor more material to work with. It would be interesting to see whether substantial compression turns into consistent savings over the whole task—and whether quality holds up.
I might even get around to it when I find the time.